


You need to present your employees or superiors with customer survey results, but you’re not sure how to go about it… Sound familiar? Then read on to discover all our tips for efficient survey result presentations. 1 – Outline Your Survey Goal and Formulate a Problem Statement Begin your presentation by explaining why you decided...

You need to present your employees or superiors with customer survey results, but you’re not sure how to go about it… Sound familiar?
Then read on to discover all our tips for efficient survey result presentations.
1 – Outline Your Survey Goal and Formulate a Problem Statement
Begin your presentation by explaining why you decided to design and deploy this survey, and what you wanted to achieve:
- What problem or issue prompted you to create this survey? What need does it address?
- What do you hope to learn from this survey?
- What type of actions do you plan on deploying afterwards? More broadly, how do you plan on putting the lessons learnt into practice?
In order to coherently structure your presentation, you need to formulate a problem statement. Your survey results should aim to answer, at least in part, this statement. This approach may sound academic, but it will enable you to capture your audience or reader’s attention.
2 – Detail Your Answer Collection Methodology
After explaining why you wanted to obtain these survey results (the goals), answer the following question: how did you obtain the results?
It is important to explain which methodology you used to collect the answers and how you obtained the results you are about to present.
You should include the following information:
- The number of people interviewed: how many people took part in and completed your survey? How many responses did you get?
- The panel: who did you interview ? How did you select your participants? On what criteria? What are the respondents’ characteristics (distribution by age, gender, geographical area, etc.)?
- Adjustments: did you make any adjustments to ensure that your sample is as representative as possible?
- The survey deployment mode: what channels did you deploy your survey on? Online? On your website? On social media? By phone? By post? By email? Face to face? Did you reward your respondents for participating?

Explaining your methodology shows that this is a serious survey. It gives credence to your results and is reassuring.
This can be more or less detailed, depending on the complexity of your survey and its deployment mode. We recommend providing essential information about your methodology in the main part of your presentation and referring to an appendix for further details.
3 – Structure Your Presentation
Now that you have explained your goals and methodology, you can present your survey results. Make sure to structure them, so as to not drown your listeners or readers in a sea of numbers and information. Otherwise, they probably won’t remember much!
This structure should be in line with your demonstration and follow the thread of your problem statement. Simply “spewing out” results in no particular order is a huge mistake. For example, any results that expand upon, clarify, explain or complete a result should be presented after it. These are basic rules of logic, but they are key to ensuring that your presentation is legible and captures your employees’ attention.
The way you structure your presentation should mirror your survey structure. Remember that a survey is never just a series of unrelated questions. Long surveys in particular should be organised into sections, each one based on a specific issue or theme. Remember to ask any generic questions before the more technical ones. If you carefully structure your survey, in a coherent manner, you will have already (almost) structured the presentation of your results.
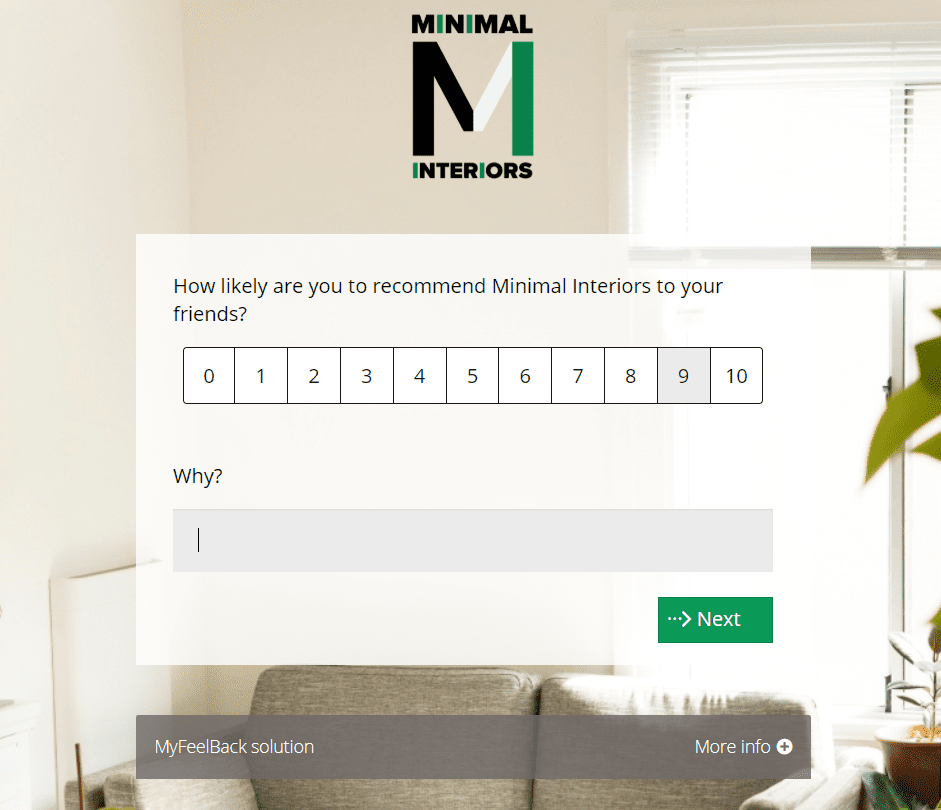
4 – Reiterate Your Questions in Writing
Survey results are based on answers given to questions. For this reason, it is important to know exactly what the questions were, in order to correctly interpret and shed light on the survey results.
For example, when stating that 90% of your customers are satisfied, remember to include the question that led you to this result.
Discover Why and how to use open-ended questions?
5 – Be Open About Small Sample Groups
The reliability of results obtained from a customer survey largely depends on the number of participants and how representative your sample is. If your survey was administered to a small number of individuals who are not particularly representative, then you should include this information in your presentation.
Indeed, you need to make this clear so that everyone can take a step back from the results, better understand them and avoid making bad decisions. It is also quite simply a matter of honesty. We will explain later how you can solve the problem of small sample groups.
6 – Summarise Key Figures
Towards the end of your presentation, after a detailed analysis of the results, you should provide a general overview of key figures. Your readers or listeners will not be able to remember everything. So, ask yourself what the most important elements to retain are. What are the most important lessons learnt in this survey? What are the main discoveries, surprises, and most significant or astonishing results?

7 – Provide Concrete and Operational Recommendations
The analysis and understanding of results should lead to decision-making and actions. The aim of a survey is to obtain information that can help steer your actions and identify areas for improvement. It is therefore important, after providing an overview of your survey results, to offer practical and operational recommendations.
Surveys help answer a problem statement, as outlined at the beginning of your presentation. Now that you have the answer, or part of the answer, at your fingertips, you can draw conclusions. What actions need to be implemented? What processes or methods need to be changed? What strategic developments should be considered?
You may conclude that you don’t have enough information to make recommendations and decisions. Perhaps the survey has helped you identify new questions to ask, or hypotheses to explore. Or maybe you simply don’t have enough answers to draw definitive conclusions. Which leads us to our final piece of advice.
8 – Suggest to Continue Survey Deployment
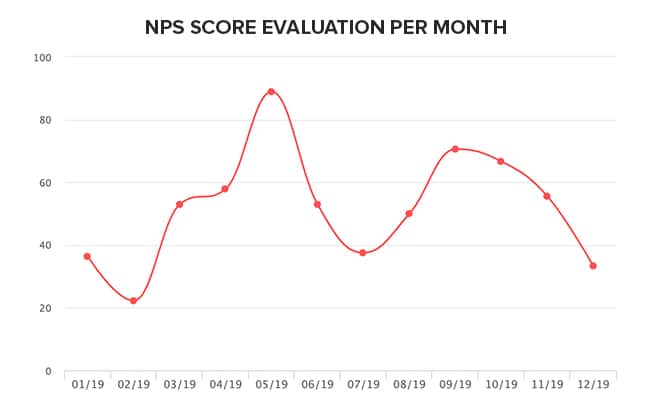
Analysing survey results can be an interesting learning experience. But monitoring results over time can be even more instructive. This is particularly true of satisfaction indicators, where the rate at a specific moment is always less telling that the evolution of these indicators month after month.
If the survey topic is particularly important, we recommend continuing to deploy the survey in order to collect new answers in real time. This will enable you to measure the impact of any actions and measures taken.
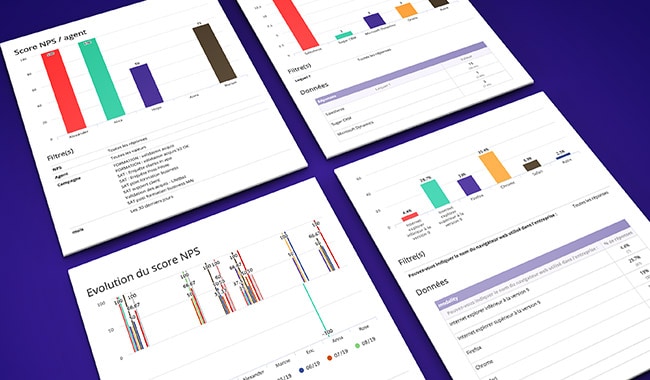
If you opt for this continual deployment mode (or at a regular frequency), we recommend using a feedback management platform, so as to easily measure the evolution of results via the solution’s dashboard. This real time reporting method also boasts many benefits compared to a one-off presentation:
- More transparent results: each employee can access the dashboard via the solution’s interface.
- All employees have access, which makes it easier to share results. With a dashboard, everyone can contribute to the analysis and reporting of results.
- Using a dashboard allows to continually monitor results and KPIs.
Discover Analysis function of MyFeelBack
Moreover, continuous surveys help remedy the problem of small samples that we mentioned earlier.
These are some of our key tips for presenting survey results in a clear and efficient manner. Most of the advice given here applies to all forms of presentation. Now, over to you!