


Does your company operate in the energy sector? Would you like to improve your customer listening to measure your customers’ satisfaction with your services? We are going to help you build your very own customer satisfaction dashboard. We will look at which indicators to include in your dashboard, and what other items to add. This...

Does your company operate in the energy sector? Would you like to improve your customer listening to measure your customers’ satisfaction with your services?
We are going to help you build your very own customer satisfaction dashboard. We will look at which indicators to include in your dashboard, and what other items to add. This customer satisfaction dashboard will enable you to strengthen your customer centric approach and to adapt your initiatives, projects and actions to your clientele’s needs and expectations.
Which satisfaction indicator(s) should you choose in the Energy sector?
If you are reading this article, you are interested in measuring your customer satisfaction. You probably have several reasons to do so:
- Immediately detecting customer dissatisfaction to handle it in a proactive manner.
- Monitoring the evolution of customer satisfaction over time.
- Understanding your strengths and weaknesses.
- Continually improving your products and services, taking into accounts your customers’ expectations and needs.
- Reducing the risk of attrition (customer churn).
3 key indicators: NPS, CSAT and CES
The first step to measuring customer satisfaction is to choose one or more satisfaction indicators. If you read this blog regularly, you will know that there are several. The 3 reference indicators are as follows:
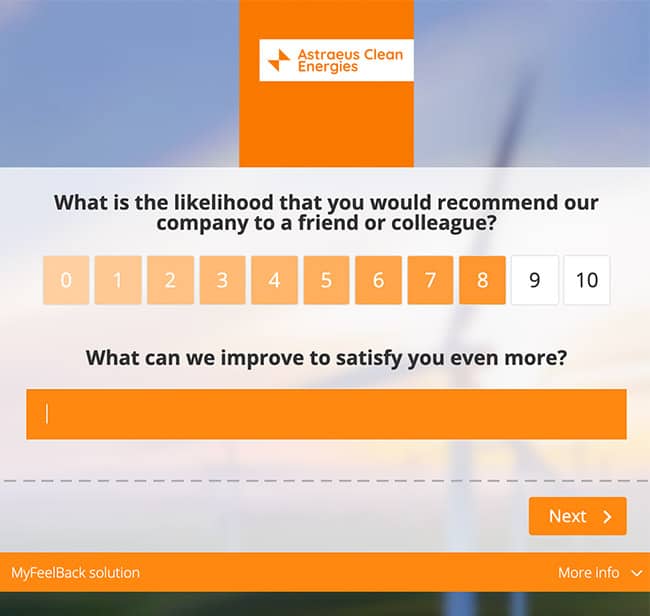
- The Net Promoter Score (NPS), that enables you to calculate your recommendation score. This score is calculated based on the answers given to the following question: “On a scale of 0 to 10, how likely are you to recommend our services to others?”
- The Customer Satisfaction Score (CSAT), which is the most well-known satisfaction indicator. It is obtained by aggregating the answers to a very simple question: “Are you satisfied with X?”. This question can of course be rephrased, but however it is worded, the respondent must choose from 5 answers, ranging from “Very satisfied” to “Not at all satisfied”.
- The Customer Effort Score (CES), that helps to identify any friction on the customer journey. This indicator consists in measuring the level of effort exerted by the customer at the different stages of the journey, whether at the beginning (signing up phase) or at the end (after-sales service, contract renewal, etc.).
Surveys are required to calculate these three indicators. In order to build a customer satisfaction dashboard, you need a solution that allows you to create and deploy surveys targeting each phase of your journey. MyFeelBack, a Customer Knowledge Solution, does exactly that. Feel free to contact us to find out more.
For more information about the Net Promoter Score, check out our complete guide to NPS
The two uses of indicators (macro & micro)
These indicators all have two different uses (macro & micro):
- Measuring customer satisfaction at a global level. E.g.: the percentage of satisfied customers or the percentage of “promoters” (as defined by the NPS). The “macro” use case allows for statistical analysis. This article mainly discusses this use case, but it is important to bear in mind that a satisfaction indicator also has another use that could be described as “micro”.
- Measuring satisfaction at an individual customer level. E.g.: Mr Martin is very dissatisfied with his energy contract. The “micro” use case allows to trigger real actions and to personalise the customer dialogue. For example, if Mr Martin declares that he is dissatisfied with your services, you can call him back to better understand his needs and deal with his dissatisfaction. With MyFeelBack, you can set up automatic alerts for your customer services (sent by email for example) if a customer gives a satisfaction score below X in a survey.
The choice of indicators
Which indicator should you choose? One or several? You can proceed in stages, starting by focusing your efforts on one indicator. In this case, we recommend choosing between the NPS (recommendation but also indirectly, satisfaction indicator) and the CSAT (classic satisfaction indicator).
Then, once you are at ease with measuring satisfaction (at every level: survey design, targeted deployment, integration of answers into your CRM and dashboard, etc.), you can consider adding a second indicator: the Customer Effort Score or CES.
The fluidity of your customer journey is key. It strongly influences the customer experience, and therefore customer satisfaction. As seen above, the Customer Effort Score allows you to evaluate the level of fluidity of your customer journey and, if necessary, identify any sticking points, irritants, and stages that are slowing down the journey. Any company in the energy sector should consider deploying this indicator in the long run.
The different indicator analysis axes to include in your dashboard
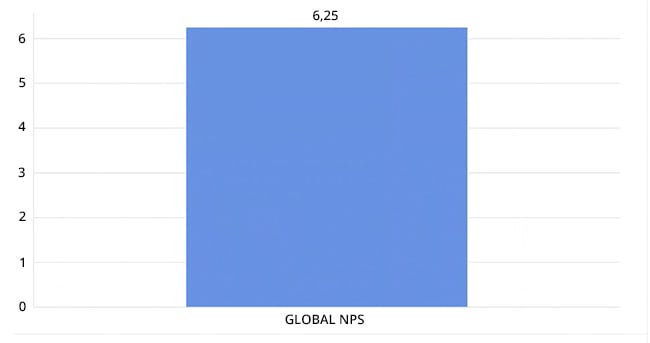
You need to analyse your indicator(s) from different angles. Take the Net Promoter Score, for example. You can start, of course, by adding the overall score to your dashboard which lies somewhere between -100 and 100. But you should not stop there.
Here are two recommendations to go a step further:
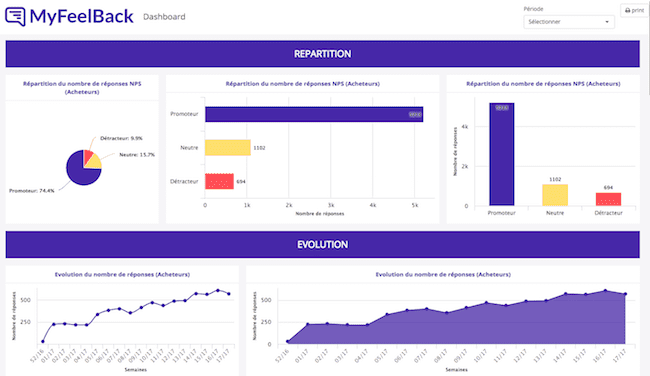
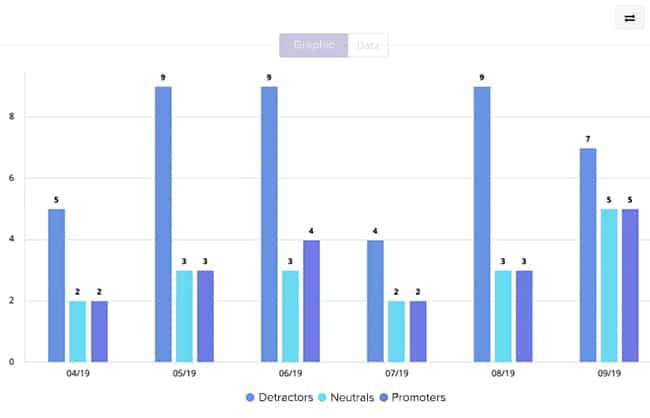
- Show the monthly evolution of your overall NPS score. As with any indicator, it is important to have a view of that specific moment in time and the “film”.
- Display the breakdown between “Promoters” / “Neutrals” / “Detractors” and the monthly evolution of this breakdown.
Measuring your company’s strengths and weaknesses (from a customer viewpoint)
Measuring satisfaction is not just about asking your customers whether or not they are satisfied. You can go much further by asking them what they like the most, and what they like the least. This will reveal your company’s strengths and weaknesses as seen by your customers.
Our advice: Identify 5 to 10 key elements in your products and services and ask your customers about each one: “How satisfied are you with X?”, “How satisfied are you with Y?”, etc. You will learn a lot.
The elements that generate the highest satisfaction rate are your strengths. Exploit them and highlight them in your communications and sales pitches. These are key elements of your value proposition.
https://www.scottishpower.co.uk
On the flip side, any elements that are sources of dissatisfaction need to be worked on. These are your areas for improvement.
Beyond indicators, enrich your dashboard with customer verbatims!
You can collect customer verbatims at lots of different touchpoints: website, social media, customer services, etc. But the simplest solution for collecting a customer’s comments, and to integrate these verbatims into your dashboard as easily as possible, is by using surveys.
Collecting verbatims with complementary questions
When building an NPS, CSAT or CES satisfaction survey, you can add a complementary question right after the NPS, CSAT or CES question. This is something we highly recommend.
The aim of this complementary question? To ask your customers the reasons behind their answer to the satisfaction question. This is a particularly effective way of collecting immediate verbatim feedback. With MyFeelBack, you can even vary the complementary question depending on the satisfaction score. For example:
- “What are the reasons for your dissatisfaction?” for respondents who give a satisfaction score below X.
- “What can we improve to satisfy you even more?” for respondents who give a score above Y.
One last thing. Customers cancel their energy contracts with you every day. It is important to ask them why by automatically sending them a customer survey after they cancel or choose not to renew their contract. We encourage you to collect verbatims in this critical situation. This will enable you to better understand your attrition rate and to identify areas for improvement of your services.
Adding verbatims to your monitoring dashboard
There are several ways to integrate verbatims and customer comments directly onto your dashboard. But first, you need to create a data flow to automatically feed the verbatims into your dashboard, in real time. If you are building a dashboard in your customer survey solution, then this does not apply. But if you have decided to create a dashboard in your CRM solution, for example, then you need to create a data flow by using an API or connector, provided by your survey solution. As a side note, MyFeelBack offers connectors for most CRM solutions on the market.
Once you have set up the data flow, the next question is: what mode of representation should you use to integrate the verbatims? We will not spend too long on this question, since it has already been answered in another article that you can read here: How to use verbatim analysis to transform customer comments into steering kpis.
Here are a few possibilities a solution like MyFeelBack can offer:
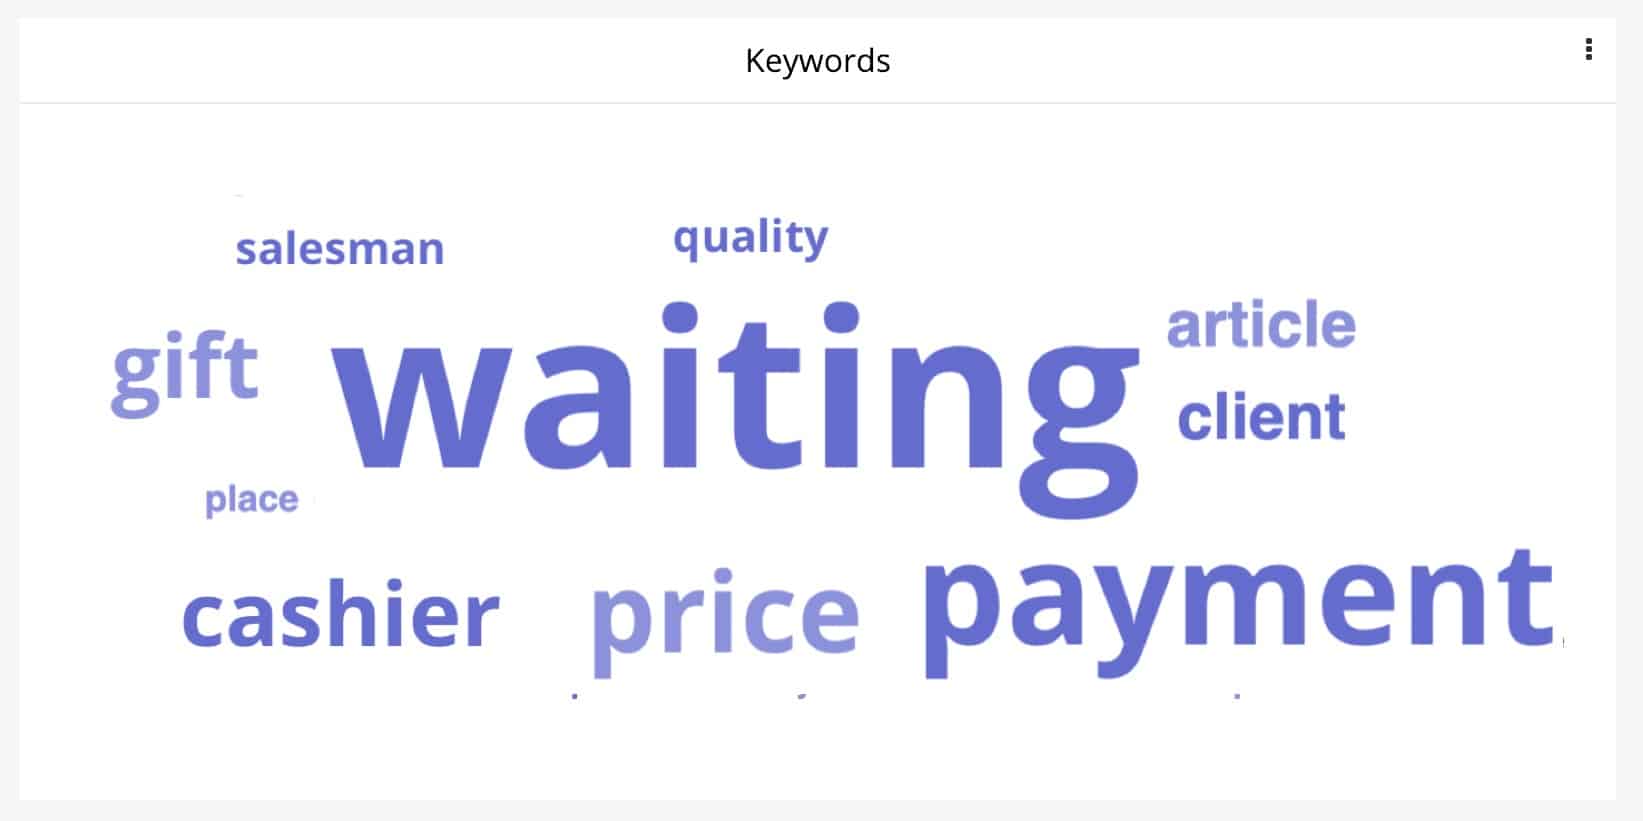
- Group the verbatims into two categories: positive and negative. Our solution uses semantic analysis to automatically classify answers according to the words used by your customers.
- Display on your dashboard the words most frequently used by customers in their comments (in the form of a tag cloud or chart).
This article is now drawing to an end. We have provided three answers to the question: “What should I include in my customer satisfaction dashboard?”:
- One or more satisfaction indicators: NPS, CSAT, CES. We have stressed the importance of using several analysis axes to learn as much as possible from your indicators.
- Strengths and weaknesses so that you can identify the elements that generate the most satisfaction and the areas you need to work on to improve the customer experience.
- Verbatims to better understand the way in which your customers talk about you and the words they use to describe you. Verbatims are a gold mine of information to better understand the reasons for satisfaction, dissatisfaction, or termination.
Finally, you can also add some “Customer Knowledge” oriented indicators to you dashboard relating to, for example:
- Consumption habits: this information is automatically collected from your customers’ accounts but can also be supplemented by customer feedback.
- The characteristics of your customers’ home: house / apartment, square footage, insulation, etc.
- Your customer acquisition sources. You can ask the customer how they discovered you: a website, print advertising, an online advertising campaign, word of mouth, etc., in order to improve your customer acquisition marketing strategy.
We hope that you enjoyed this article. If you have any questions about this topic that were not covered in the article, then please get in touch with our experts via the form. We have worked alongside several companies in the Energy sector to structure their monitoring system. We would be delighted to help you too.