


Wait Time, First Contact Resolution, Net Promoter Score, CES, Satisfaction Score, Average Call Handling Time… Discover the key KPIs to measure your customer service performance, motivate your teams and improve your quality of customer service. The Key KPIs to Measure Customer Service Performance 1. First Contact Resolution Rate First Contact Resolution is a KPI that...

Wait Time, First Contact Resolution, Net Promoter Score, CES, Satisfaction Score, Average Call Handling Time… Discover the key KPIs to measure your customer service performance, motivate your teams and improve your quality of customer service.
The Key KPIs to Measure Customer Service Performance
1. First Contact Resolution Rate
First Contact Resolution is a KPI that is increasingly used for customer service management. It measures the proportion of requests that are processed and resolved in a single contact. The First Contact Resolution rate (FCR) is calculated by dividing the number of events processed and resolved at first contact by the total number of events processed (multiplied by 100).
Resolution at first contact benefits both the company and the customer. On the one hand, it reduces processing costs. And on the other hand, customer service’s ability to resolve requests in one interaction impacts customer satisfaction. The First Contact Resolution rate reflects the performance, as well as the quality, of customer service, which is why this indicator is often used to measure customer satisfaction.
2. Wait Time
This KPI is often used to measure the accessibility of customer services. The Wait Time is the average amount of time it takes for a customer to be connected to customer services.
3. Customer Service Pickup Rate
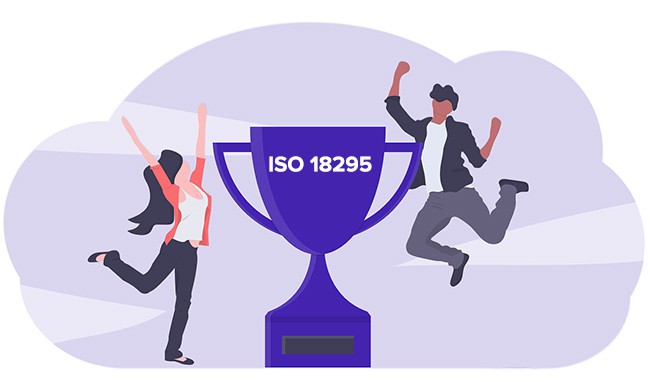
The Pickup Rate measures the number of calls answered in comparison to the number of incoming calls. This rate is crucial because not being able to reach customer services results in very high dissatisfaction levels. The Wait Time and the Pickup Rate are two indicators used for ISO 18295 certification. This is awarded to customer services that are able to answer at least 80% of calls in less than one minute and thirty seconds.
4. Average Call Handling Time
The Average Call Handling Time is mainly used to manage your customer service’s budget.
This traditional KPI is becoming less popular because it often isn’t in line with current business challenges, in particular personalising the customer relationship and listening to them. You could even say that the Average Handling Time is an anti-customer-centric KPI, because seeking to improve it tends to negatively impact quality.
5. Net Promoter Score (NPS)
Let’s now move on to KPIs that are centred around the customer, their satisfaction, and their loyalty. One of the best known ones is the Net Promoter Score (NPS). NPS is a satisfaction score. It is calculated based on the answers to the following question:
“On a scale of 0 to 10, how likely are you to recommend our brand/company/service to your friends/colleagues/family?”
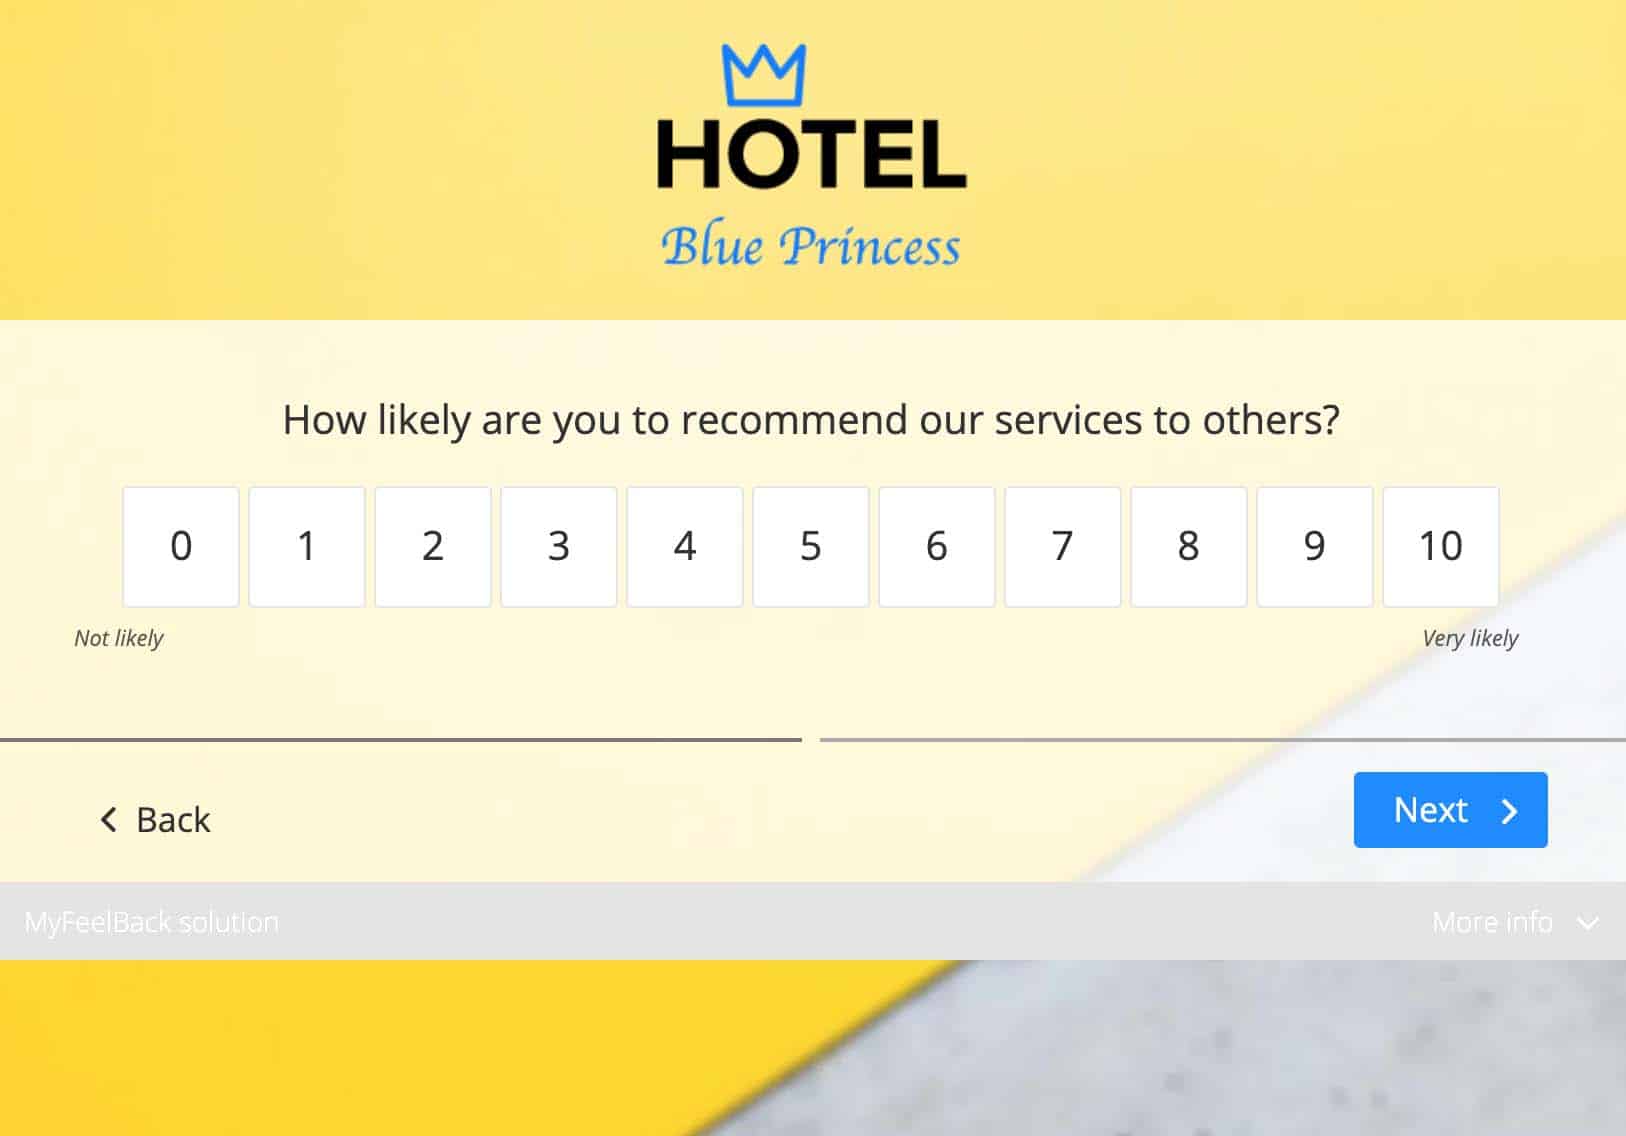
You can ask your customers an NPS question after they interact with customer services. How? Via a post-contact satisfaction survey sent by SMS or email, for example. NPS measures your customer service’s overall performance, as well as that of individual agents.
We recommend following up your NPS question with another, in order to obtain results that you can then use. For example, you could ask customers who rate you poorly: “How do you think we could improve?”
6. Customer Effort Score (CES)
The less effort a customer has to exert, the more likely they are to remain loyal. This has been scientifically proven by a Customer Contact Council study conducted with 75,000 people.
Just like NPS, the Customer Effort Score (CES) is a KPI that enables you to measure customer satisfaction. The CES score is obtained by asking post-contact customers a question, such as:
“How easy was it to get your query handled?”
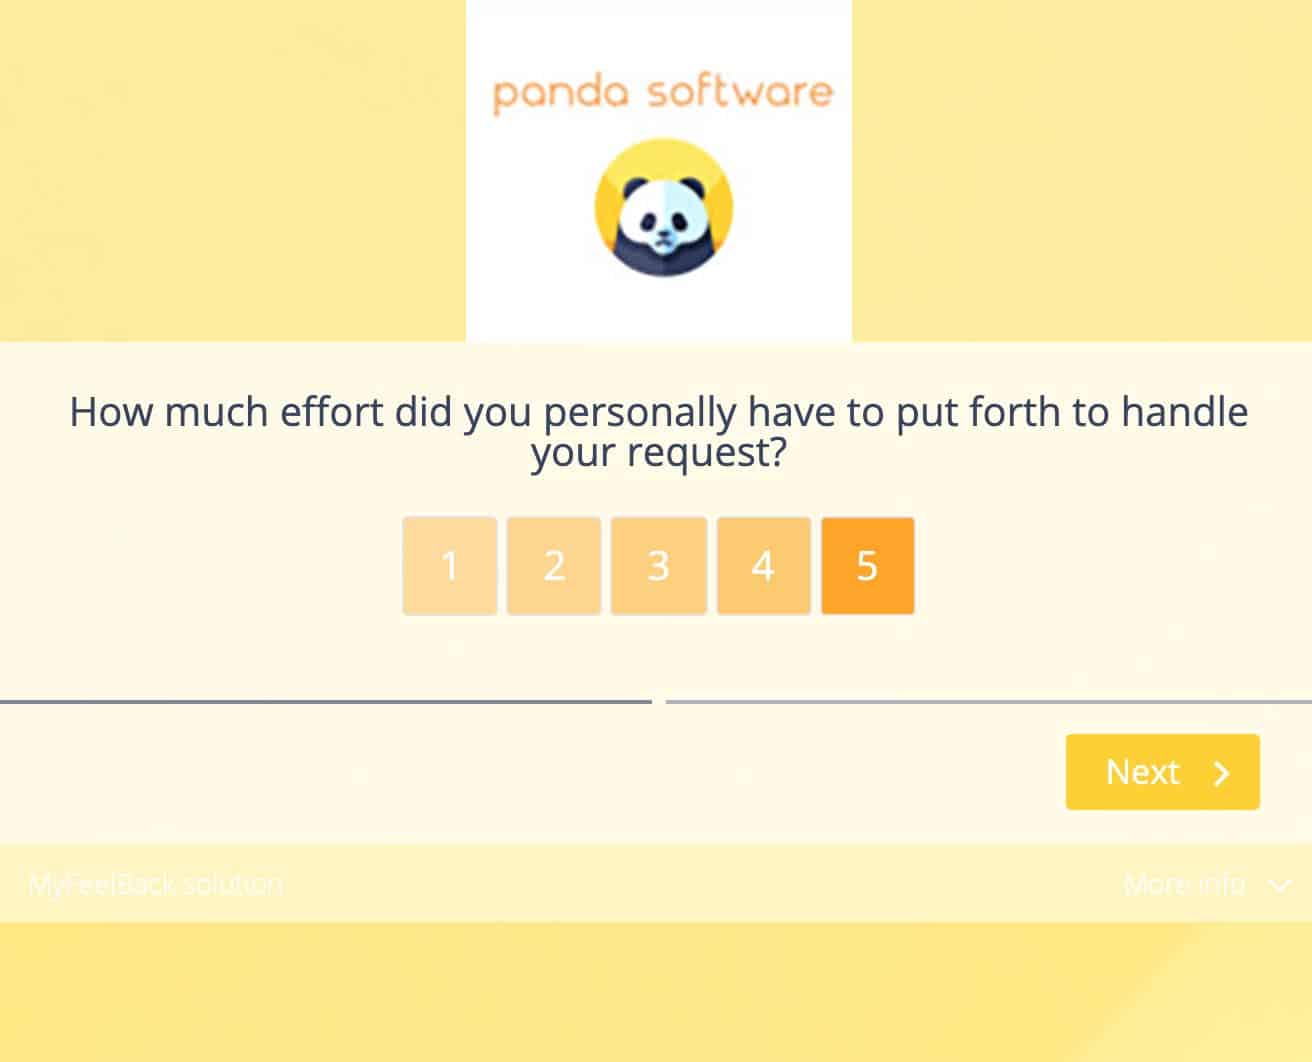
CES assesses the level of effort exerted by your customers during a specific interaction, in this case, contact with your customer service. You can add CES questions to your post-contact surveys.
7. Customer Satisfaction Score (CSAT)
The Customer Satisfaction Score, or CSAT, is a basic yet essential indicator. It is the ultimate satisfaction indicator. The satisfaction score is calculated by aggregating the responses to this simple question:
“How satisfied are you?”
or
“Are you satisfied with X?”
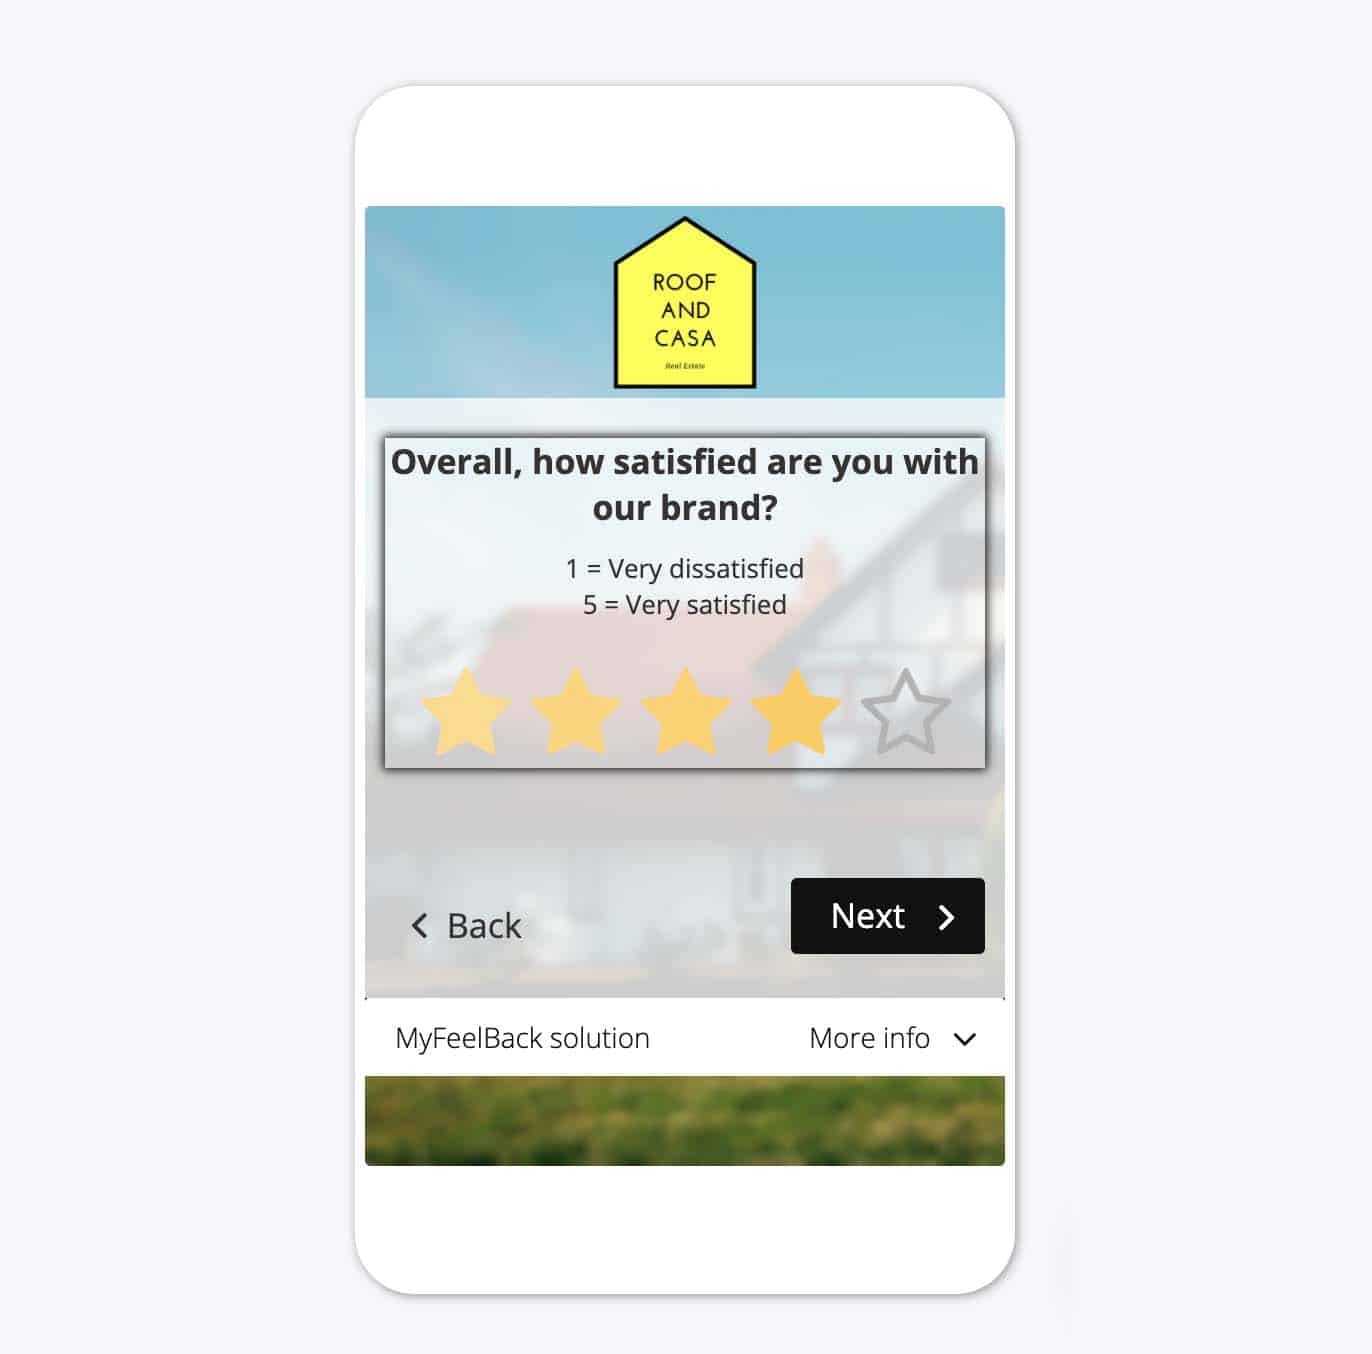
The customer then has the choice of 4 or 5 answers: Very satisfied / Satisfied / Neutral / Rather not satisfied / Not at all satisfied.
But satisfied with what? We recommend calculating a satisfaction score for each interaction. With regards to customer services, you could measure satisfaction with:
- Wait time
- Friendliness and listening skills
- Quality of explanations
- Clarity of information provided (for example a clear presentation of the company for a new contract request)
- Quality of customer service follow-up
These last three customer service KPIs (NPS, CES and CSAT) are very different to the first ones. They are centred around the customer and the assumption that customer service performance is based on fully satisfying customers.
How to Collect Customer Service Satisfaction KPIs
At MyFeelBack, we firmly believe that a customer-centric approach when measuring customer service performance is the most efficient and beneficial. Satisfaction KPIs are starting to replace traditional ones, in particular productivity KPIs (number of calls handled per agent, time between each call, etc.). Satisfaction KPIs are more in line with current customer relationship challenges.
With our solution, you can send targeted post-contact surveys via different channels (emails, SMS, calls, etc.). Targeted MyFeelBack surveys help measure overall customer service performance, as well as that of individual teams and agents. You can set your own rules to trigger your surveys. For example, you can automatically send a satisfaction survey by email following a contact with customer services.
We recommend email and conversational SMS when sending post-contact surveys. Most of our clients report higher response rates on these channels. Take for example our client Amaguiz, an insurance provider. They send a satisfaction email after every contact with customer services and use MyFeelBack to automatically send surveys by email. If a customer expresses dissatisfaction, an automatic call back is triggered to identify the reasons for their discontent.
How to Continuously Monitor Customer Service Satisfaction KPIs
The data collected from MyFeelBack surveys, then feeds into a decision-making dashboard, on which you can monitor your various KPIs in real time.
Each decision-making dashboard is made up of customer indicators, fed by customer feedback via our smart surveys. They are fully customisable to meet each company’s specific expectations and strategy.
The results can be deployed to all company employees. They can be classified in different ways: by agent, by team, by type of contact, etc. This enables the voice of the customer to become a central part of your organisation and for all departments to be informed in real time.
We strongly recommend cross-referencing these KPIs with your satisfaction survey responses. This will enable you to compare your customer service’s productivity and professionalism with what your customers think of your quality of service.

// ><!