

Retail professionals are aware of the importance of customer satisfaction and a positive in-store customer experience. In order to increase customer loyalty and grow their client base through word-of-mouth. For some brands, monitoring customer satisfaction has become equally as important as tracking turnover or net earnings. When creating your customer satisfaction strategy, it is essential...

Retail professionals are aware of the importance of customer satisfaction and a positive in-store customer experience. In order to increase customer loyalty and grow their client base through word-of-mouth. For some brands, monitoring customer satisfaction has become equally as important as tracking turnover or net earnings.
When creating your customer satisfaction strategy, it is essential to also develop an effective reporting system. Developing a customer satisfaction barometer for your retail business addresses three key objectives:
- Measuring customer satisfaction and track changes using relevant indicators
- Sharing your barometer with your company’s different teams and departments to help them implement their customer-centric strategy
- Encouraging and motivate all collaborators to work towards the company’s goals
In this document, we’ll guide you through the various different steps involved in creating a customer satisfaction barometer for your retail company.
Retail: Why Creating a Customer Satisfaction Barometer?
A brief definition before we begin: a customer satisfaction barometer is a reporting tool that enables companies to measure their customers’ level of satisfaction, continuously and in real-time. It usually includes a dashboard that is made up of graphic elements showing changes to various different indicators.
Customer satisfaction barometers are becoming more and more common in retail. This is because retail professionals are aware that they can no longer rely only on their offering of products or services to differentiate their company. Their main differentiating factor is now the quality of the customer experience.
The customer experience refers to all feelings and emotions that customers have towards the brand. The customer experience is created through interactions between the customer and the brand, before, during and after making a purchase. It determines customers’ image of the brand, as well as their degree of satisfaction. A positive customer experience leads to increased customer satisfaction, and vice versa.
How can a brand build customer loyalty?
Of course, through the products that they sell, but this is only one aspect of the customer experience, and not necessarily the most important one. Above all, customer loyalty is based on the quality of the service, advice and information provided by customer service representatives, the ambience and cleanliness of the store, customized offerings, etc.
To increase customer loyalty and attract new customers, retail chains need to prioritize customer satisfaction. In addition to the many other benefits of focusing on customer satisfaction, it is a key driver of business performance.
Your barometer is the foundation of your strategy to increase customer satisfaction. It enables you to:
- Continuously track changes in customer satisfaction ratings.
- Make informed decisions and effectively manage your customer-centric approach.
- Quickly identify any issues that may be lowering your customer satisfaction scores.
- Inspire, motivate, and more effectively manage your company’s teams, the driving force of your company.
Which customer satisfaction indicators to include in a barometer?
Before creating your barometer, it is important to decide which customer satisfaction indicators you would like to track, as these will be used to build your dashboard. There are three main indicators that you can use to measure customer satisfaction:
1) Net Promoter Score
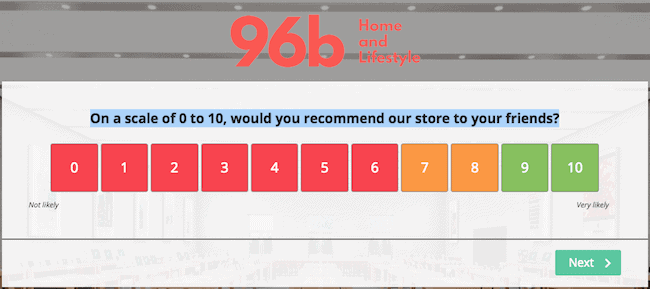
The Net Promoter Score, or NPS, helps you determine how likely your clients are to recommend your company to friends or family. It lets you measure overall satisfaction and shows how connected your clients feel to your store or brand, thus showing customer loyalty.
For more information about this important indicator, feel free to take a look at our complete guide to the NPS.
2) Customer Satisfaction Score
The Customer Satisfaction Score (CSAT) measures customer satisfaction following an interaction with your company (for example, communicating with customer service, making a purchase on your website, etc.) You can use it to evaluate specific aspects of the in-store customer experience: the quality of service and advice provided, product availability, accessibility, etc.
3) Customer Effort Score
The Customer Effort Score (CES) shows the amount of effort required by your customers to achieve their objective or take a specific action. The CES is an indirect indicator of customer satisfaction, as it measures the customer experience, which is one element that contributes to the customer’s overall satisfaction. To learn more, watch our webinar on the Customer Effort Score.
Of course, you can also use other indicators. For example, you could also measure your customers’ intention to repurchase by asking if they intend to return to the store. This would be another indirect way to measure customer satisfaction.
At the same time, we recommend not including too many indicators on your dashboard. We suggest focusing on two to four indicators, as this will provide more than enough data to offer a detailed look at your customers’ level of satisfaction.
Tell a story through your customer satisfaction barometer
The barometer is a dashboard that consists of different graphic elements (bar charts, pie charts, line charts, rankings, etc.) showing customer satisfaction data and changes to this data over time. To improve the readability of your barometer, we recommend organizing it into categories, going from the most general data to the most detailed. It should not simply look like a list of indicators.
You know you’re heading in the right direction if you have the impression that you’re telling a story as you move through the different sections of your barometer.
Layout for a customer satisfaction barometer:
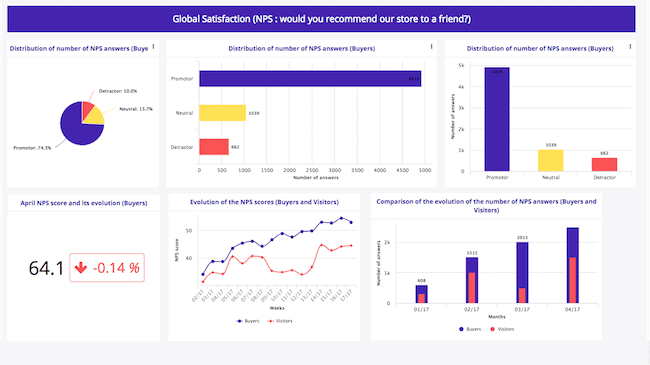
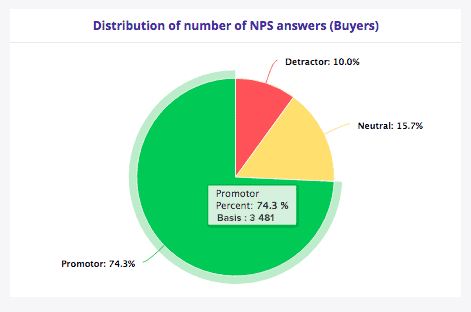
- Overall customer satisfaction level for your brand. This section is largely based on the NPS.
- Customers’ in-store experience. Focusing on their most recent visit, this section shows customer satisfaction at each step of the customer journey.
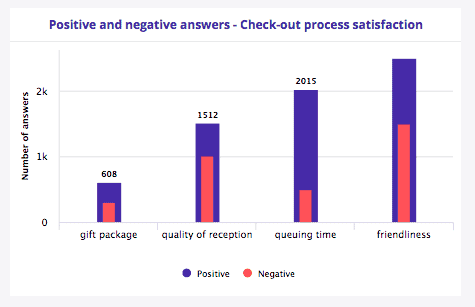
- Focus on one of your “key moments”. Some moments of the customer journey could present more challenges than others (the checkout process, home delivery, etc.) It’s up to you to choose which steps to analyze, based on your company’s own strong points and areas for improvement. Below is an example for the checkout process:
Our recommendations
We recommend showing your results in numbers as well as in percentages. Your results in numbers are unlikely to convey the desired information unless you compare them to the total number of answers collected. Displaying this information dynamically will make your barometer easier to read.
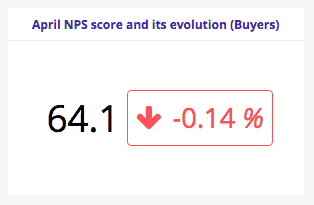
We also recommend showing changes to these indicators, in percentages, and using colour codes and arrows to show if the values are increasing or decreasing (see the example below). Generally speaking, the changes to these values are often more important than the results at any given moment. This is another reason that your barometer should display more than simply the results in numbers.
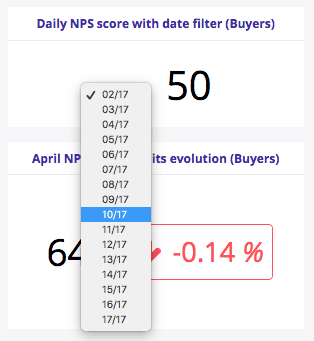
Finally, we suggest using filters to help you navigate through your data. These will enable you to customize how your barometer is displayed based on different variables: time periods, characteristics, campaigns, deployments, etc.
The dashboards offered by customer knowledge management tools provide a variety of different options for displaying your data (the images in this article are from Feedback Management dashboards.)
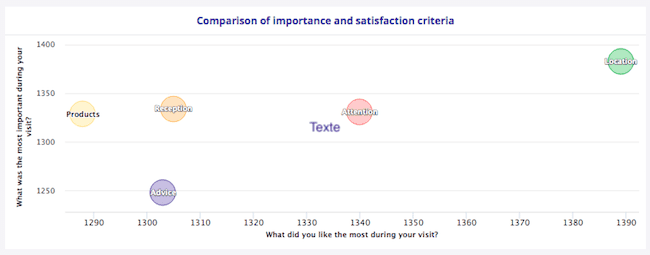
Whenever possible, compare your different indicators. Doing this will enable you to understand any similarities or differences in your data. In this example, we can see a comparison of purchasers’ and visitors’ thoughts on the customer journey.
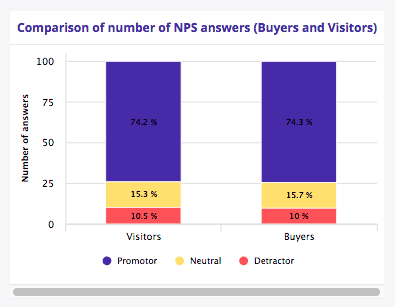
Using several different data collection methods will allow you to obtain enough feedback to continuously update your customer satisfaction barometer in real-time.
How should you share your customer satisfaction barometer, and with whom?
Your barometer should be shared with all of the stakeholders, in order to include them in your customer-centric approach and enable them to see the impact that their work has on customer satisfaction, in real-time.
Additionally, if your retail brand has a national network of stores, you can create a series of different barometers. Each level of the company should have its own barometer, as they will each have different objectives. With this in mind, we recommend creating barometers:
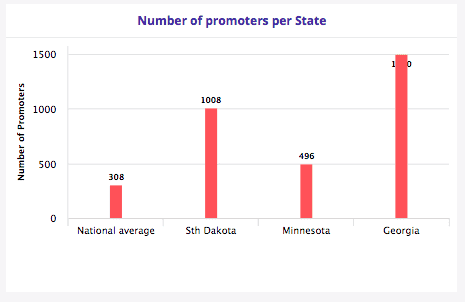
- At the national level: This barometer is meant to measure the brand’s overall level of customer satisfaction and track changes to this over time. The “national” barometer can also include regional data, in order to perform detailed and comparative analyses.
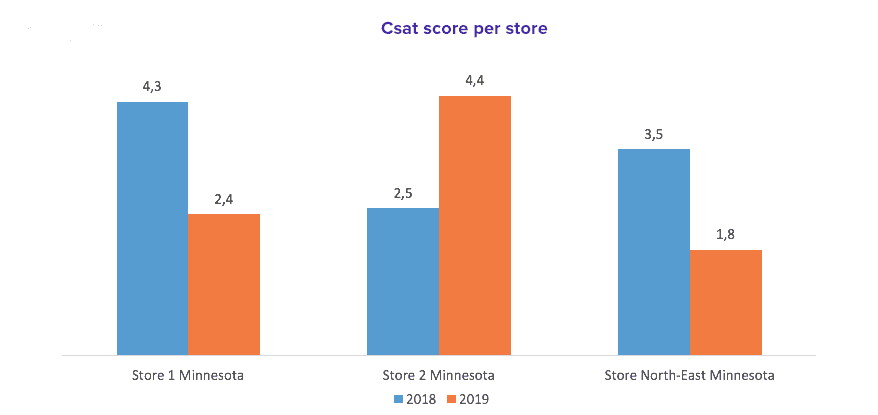
- the regional level: this barometer enables you to gain a global perspective of customer satisfaction in the region’s different stores. At this level, you can compare both the performance of the various different stores, as well as compare each store’s performance with regional and national averages.
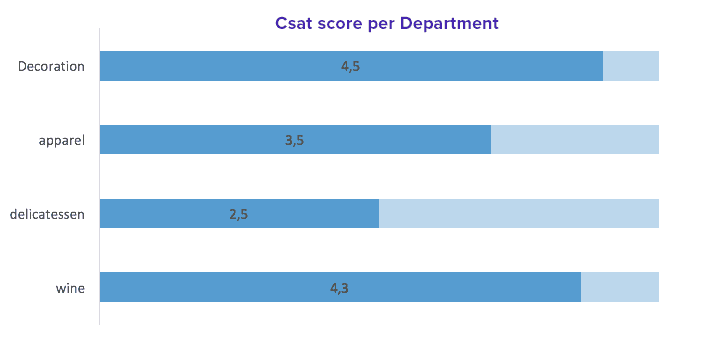
- At a local level, meaning at the point of sale. For this barometer, we recommend including data that will be helpful for the store’s staff. This “store-level” barometer can also display results for the store’s different departments.
Our recommendations
You may wish to share your customer satisfaction results with the public (e.g. “90% customer satisfaction”). This can help improve customer perception regarding your point of sale, especially when the store has high customer satisfaction ratings.
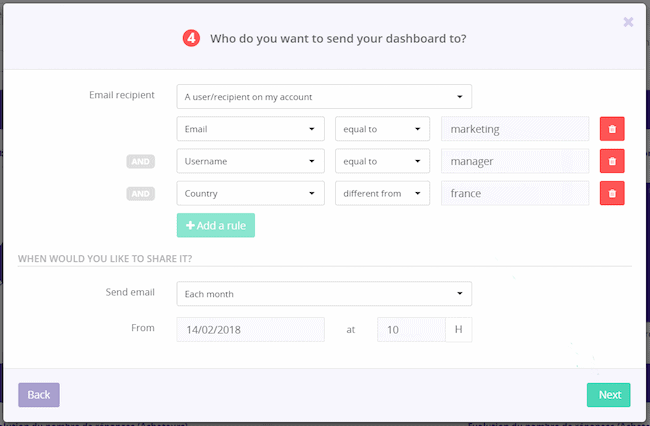
We recommend choosing a tool that will enable you to manage your various different barometers, as well as sharing permissions. With some tools, you can generate statistical reports based on filtered dashboards. These reports offer a snapshot of customer satisfaction at a given moment, and can be shared with collaborators, either occasionally or on a regular basis, by email or via a URL. This allows management to maintain control over how these dashboards are organized and shared.
Another option is to give your collaborators access to the platform used to manage your barometers. Using a SaaS solution makes this easier, as your collaborators are able to access the barometers that they need and track changes to customer satisfaction data in real-time. It’s up to you to choose the approach that works best for your company.
How should I collect data at the point of sale?
So you’ve designed your barometer and chosen indicators that will let you measure customer satisfaction in real-time — now you just need data. You’ll need to choose data collection strategies that will let you add data to your barometer and track changes to your indicators in real-time.
In the world of retail, there are various techniques that are used to collect customer satisfaction data. We do not recommend surveying customers too long after the purchase/interaction in question, as these surveys do not enable you to continuously add “real-time” data to your dashboards.
Using mystery shoppers is also not an ideal method for obtaining data for your barometer. We generally recommend focusing on collecting feedback soon after the customer’s purchase or interaction with your brand, using a method that lets you add data to your barometer in real-time. Here are a few options:
- Self-checkout surveys. This strategy has notably been used by Ikea: after a customer has used the self-checkout and paid for their purchases, they are invited to rate their experience.
- Cash register receipts. On the back of their receipts, Burger King invites customers to take an online survey, offering a free hamburger to those who participate.
- Customer loyalty programs. You can send customer satisfaction surveys to customers who have subscribed to loyalty programs, by email or text message, as part of your relational marketing campaigns.
- Surveys using tablets. With this type of survey, feedback is collected from customers in-store.
- QR Codes. These allow customers to access surveys via their smartphones. QR codes can be displayed at the entry of the store, at the cash register, on receipts, etc.
- Intelligent survey solutions. This option allows you to send customized and targeted surveys across various different channels, including websites, social media, email, mobile apps, etc.
In conclusion
Remember that, first and foremost, the customer satisfaction barometer should assist you with your decision-making process. By analyzing indicators and changes to these over time, you can determine which specific actions you can take to improve the customer experience, and measure the impact of these actions in real time. The customer satisfaction barometer is a tool that can help you effectively steer your customer-centric strategies at both a national and local level.